This article has not yet been translated in the language shown. It is displayed in machine translation, but it may be incorrect.
The Post Overview dashboard shows you the basic performance of your posts, such as the number of posts, average engagement per post, trend by time of day, and engagement by hashtag.
In the graphs and tables, the metrics are displayed based on the date the posts were made from the X (Twitter) account. For example, if a post was published on July 1 and received a reply on July 2, that reply will be attributed to the engagement of the post from July 1.

Analysis items that can be displayed
-
Post overview
- Impressions
- Average engagement
- Posts by type
- Percentage of posts with media
- Average engagement by media type
- Percentage of posts with links
- Average engagement with/without links
- Percentage of posts with hashtags
- Average engagement with/without hashtags
- Average engagement by hashtags
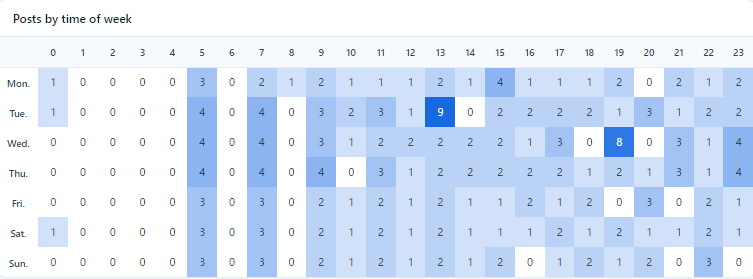
- Posts by time of week
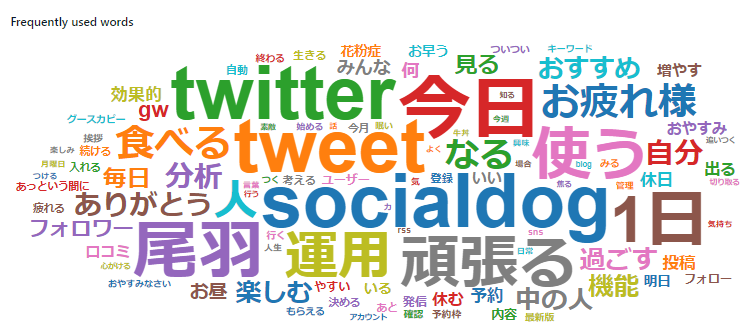
- Frequently used words
Post overview
The Post overview section provides a visual representation of your posting activity, showcasing the total counts of posts, replies, reposts, and likes in a clear and engaging graph.
Impressions
In the Impressions section, you can check the number of impressions your posts have received.

The metrics are displayed based on the date the posts were made from your social profile. For instance, if a post was published on July 1 and received impressions on July 2, those impressions will be attributed to the engagement of the post from July 1.
Average engagement
The Average engagement section provides a visual representation of the average interactions your posts receive over time. By clicking on the title, you will be directed to the detailed average engagement analysis page for further insights.
Posts by type
The Posts by type section allows you to view your posts by type. Posts are categorized into the following 3 types:
- My normal posts
- My replies
- My reposts (Retweets)

Percentage of posts with media
The Media section allows you to view the percentage of you posts with or without media in a graph.

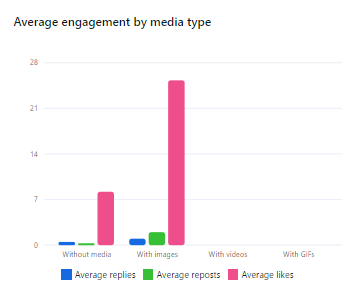
Average engagement by media type
The Average Engagement by Media Type section allows you to view the average number of replies, reposts, and likes for each type of media. You can quickly identify the types of media that generate the most engagement.
Percentage of posts with links
The Links section allows you to view the percentage of your posts with or without links in a graph.

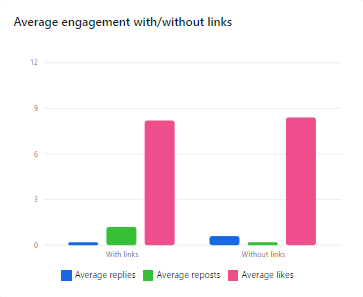
Average engagement with/without links
The Average engagement with/without links section allows you to view the average number of replies, reposts, and likes for posts with or without links.
Percentage of posts with hashtags
The Percentage of posts with hashtags section allows you to view the percentage of your posts with or without hashtags in a graph.

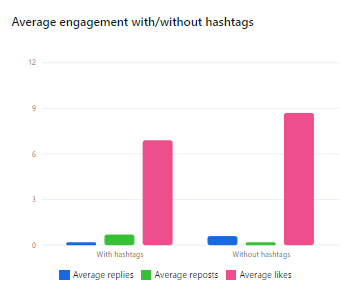
Average engagement with/without hashtags
The Average engagement with/without hashtags section allows you to view the average number of replies, reposts, and likes for posts with or without hashtags.
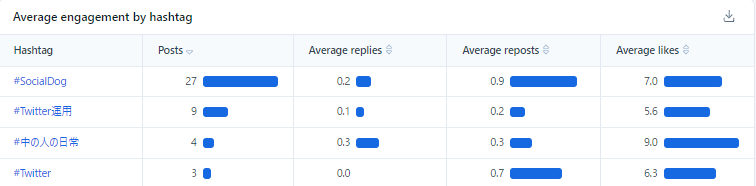
Average engagement by hashtag
The Average engagement by hashtag section allows you to view the number of posts, average replies, average reposts, and average likes for each hashtag in a table.
Posts by time of week
The Posts by time of week section allows you to view the days and times you posted in a table.
Frequently used words
The Frequently used words section allows you to view the words you often post in a table. The more you use a word, the larger it will appear.
Download Average Engagement by Hashtag Data in CSV
You can download hashtag engagement data in CSV format.
Note: CSV downloads are only available in the PC browser.
To download hashtag engagement data in CSV format:
- Click "Analytics" and then "Post overview".
- Select the analysis period you want to download.
- Click the "CSV download" button next to "Hashtag Engagement".
Change the analysis period and aggregation interval
You can change the analysis period and aggregation interval in "Post overview". The analysis period available to you will vary depending on your plan. For more information, please see your plan.
The aggregation interval can be selected from "Day, Week, Month".
- Click "Analytics" >"Post overview".
- Choose the desired aggregation interval by clicking the "Day, Week, Month" button located in the upper right corner of your screen.
- Change the date to the right of the aggregation interval to change the analysis period.