Post Summary (X)
In "Post Summary", you can check basic performance information about your posts, such as "Number of Posts", "Average Engagement per Post", "Trends by Post Time", and "Engagement by Hashtag".
In each graph and table, values are displayed on the day posts were made from your X (Twitter) account. For example, if a reply to a post made on July 1st occurred on July 2nd, it will be displayed as a reply for July 1st.
Available Analysis Items
- Post Summary
- Impressions
- Average Engagement
- Type of Posts Made
- Media Ratio
- Average Engagement by Media Type
- Link Inclusion Ratio
- Average Engagement by Link Inclusion
- Hashtag Inclusion Ratio
- Average Engagement by Hashtag Inclusion
- Average Engagement by Hashtag
- Posts by Day of Week/Time
- Frequently Used Words
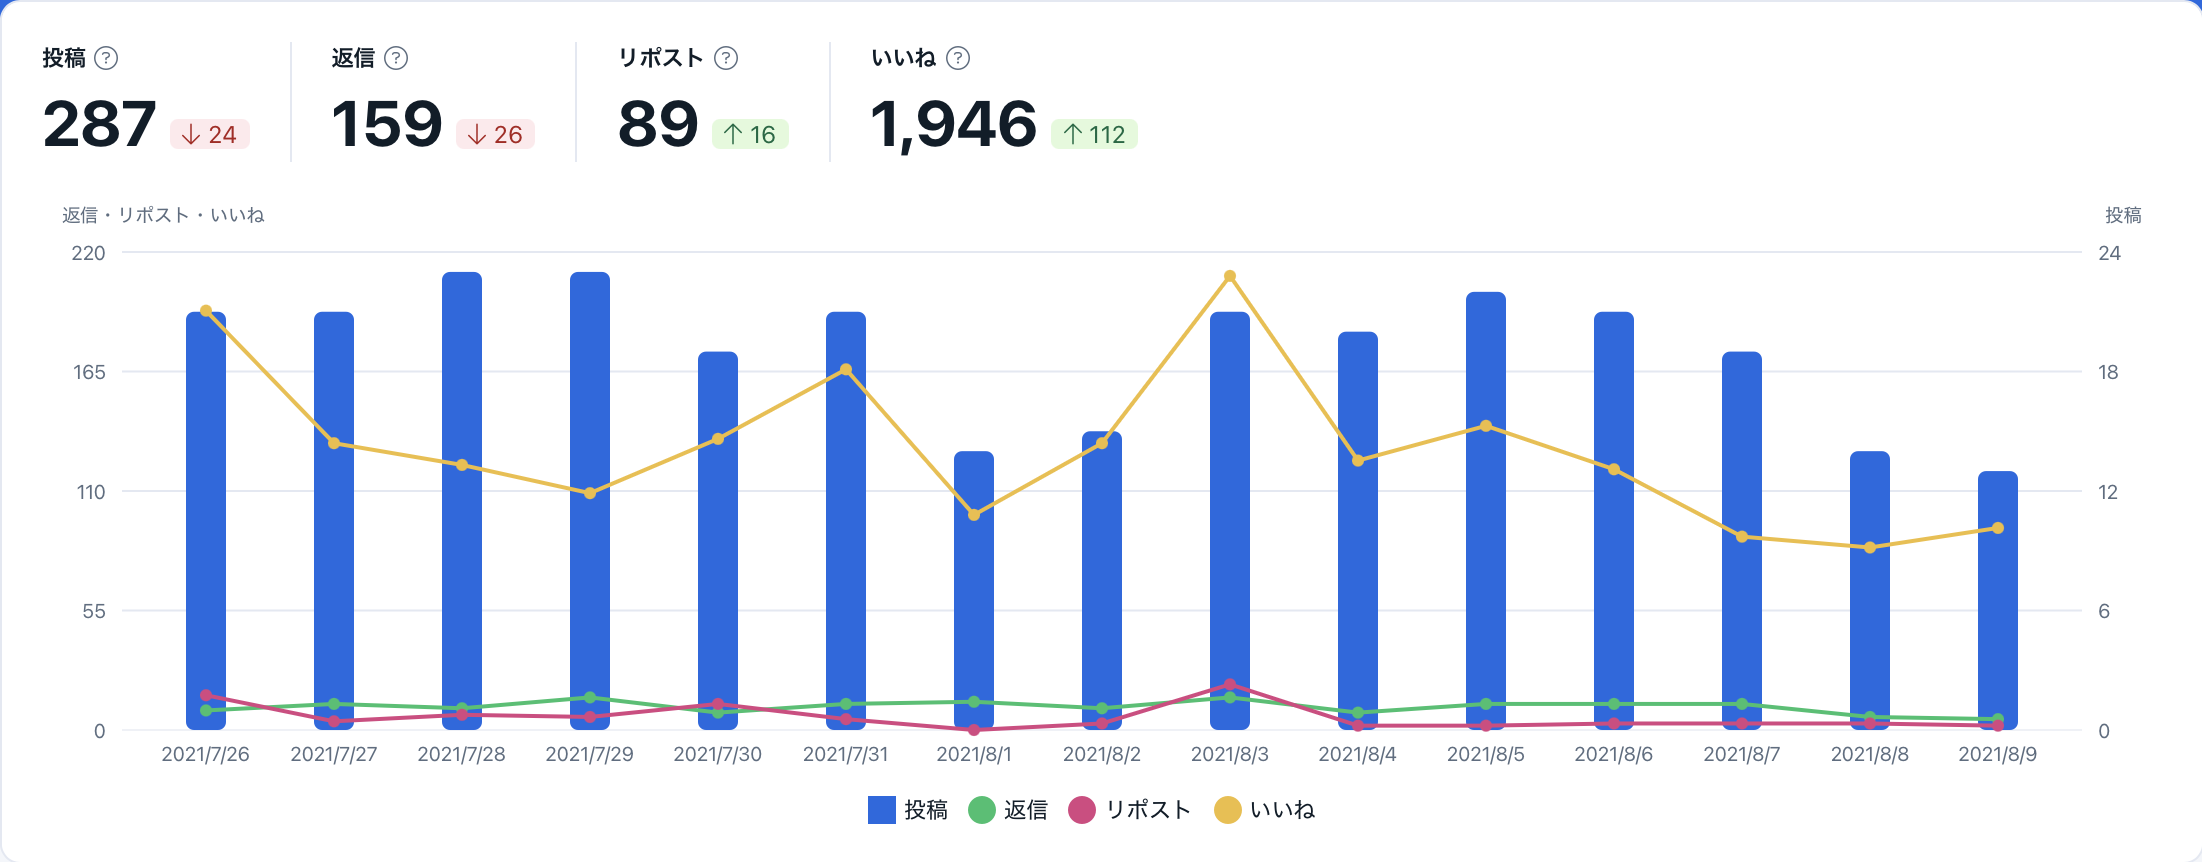
Post Summary
In "Post Summary", you can view data such as "Number of Posts", "Number of Replies", "Number of Reposts (Retweets)", and "Number of Likes" from your own posts in a graph.
Impressions
In "Impressions", you can check the impressions for your posts.
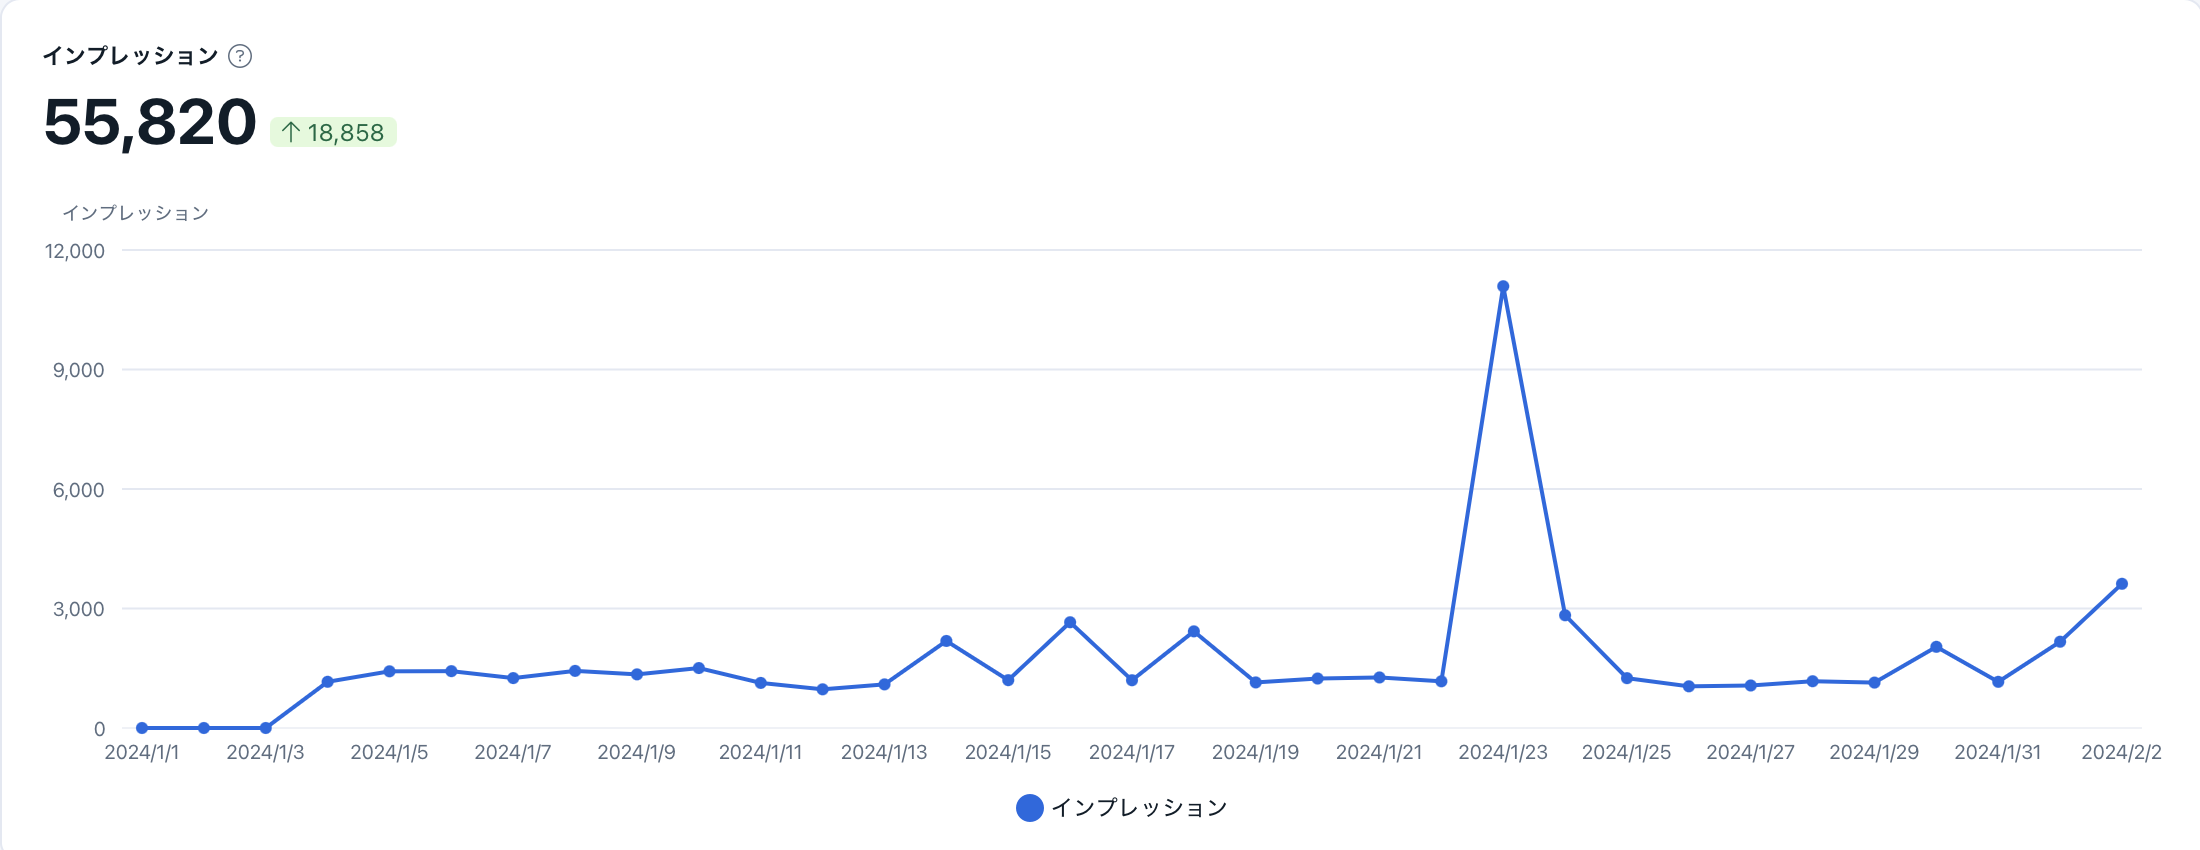
Values are displayed on the day posts were made from your SNS account. For example, if impressions for a post made on July 1st were gained on July 2nd, they will be displayed as impressions for July 1st.
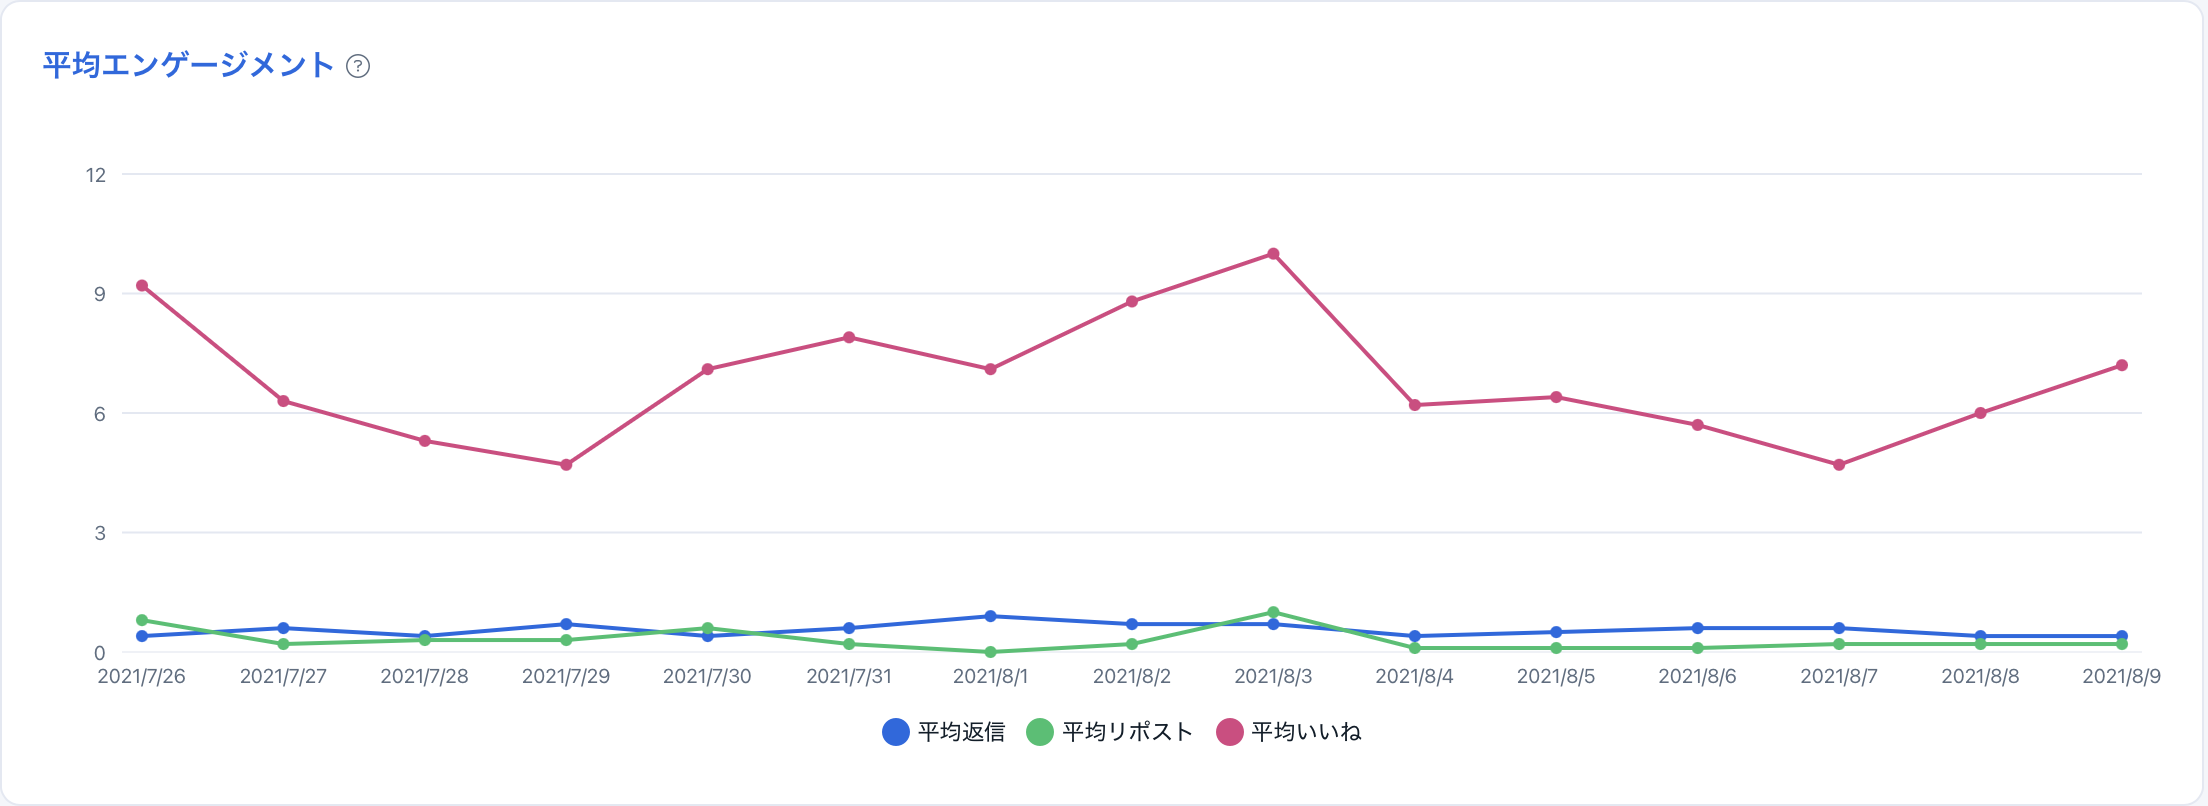
Average Engagement
In "Average Engagement", you can view the trend of average engagement per post in a graph. Clicking the title will navigate you to the average engagement analysis page.
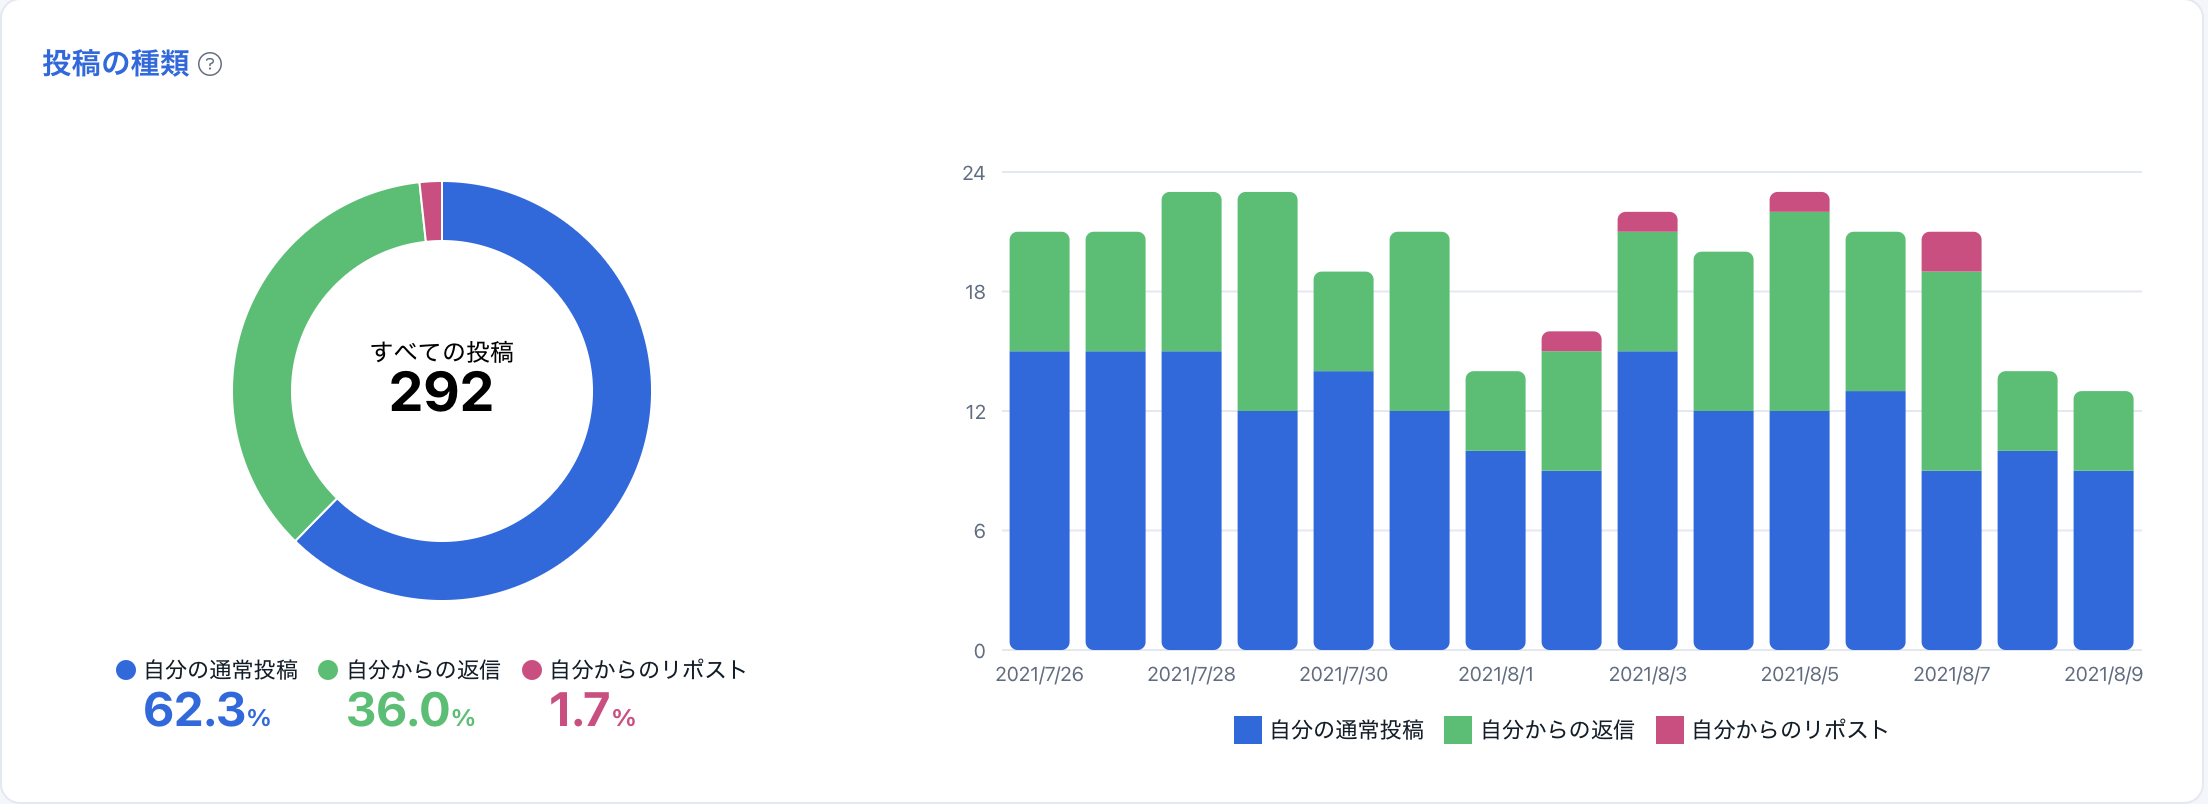
Type of Posts
In "Type of Posts", you can check the number of your posts by type. Posts are categorized into the following three types:
- Your regular posts
- Replies from you
- Reposts (Retweets) from you
Media Ratio
In "Media", you can view the ratio of media inclusion in your posts in a graph.

Average Engagement by Media Type
In "Average Engagement by Media Type", you can check "Average Number of Replies", "Average Number of Reposts (Retweets)", and "Average Number of Likes" for each media type. You can quickly identify media types with high engagement.

Link Inclusion Ratio
In "Links", you can view the ratio of link inclusion in your posts in a graph.

Average Engagement by Link Inclusion
In "Average Engagement by Link Inclusion", you can check "Average Number of Replies", "Average Number of Reposts (Retweets)", and "Average Number of Likes" based on the presence or absence of links.

Hashtag Inclusion Ratio
In "Hashtags", you can view the ratio of hashtag inclusion in your posts in a graph.

Average Engagement by Hashtag Inclusion
In "Average Engagement by Hashtag Inclusion", you can check "Average Number of Replies", "Average Number of Reposts (Retweets)", and "Average Number of Likes" based on the presence or absence of hashtags in your posts.

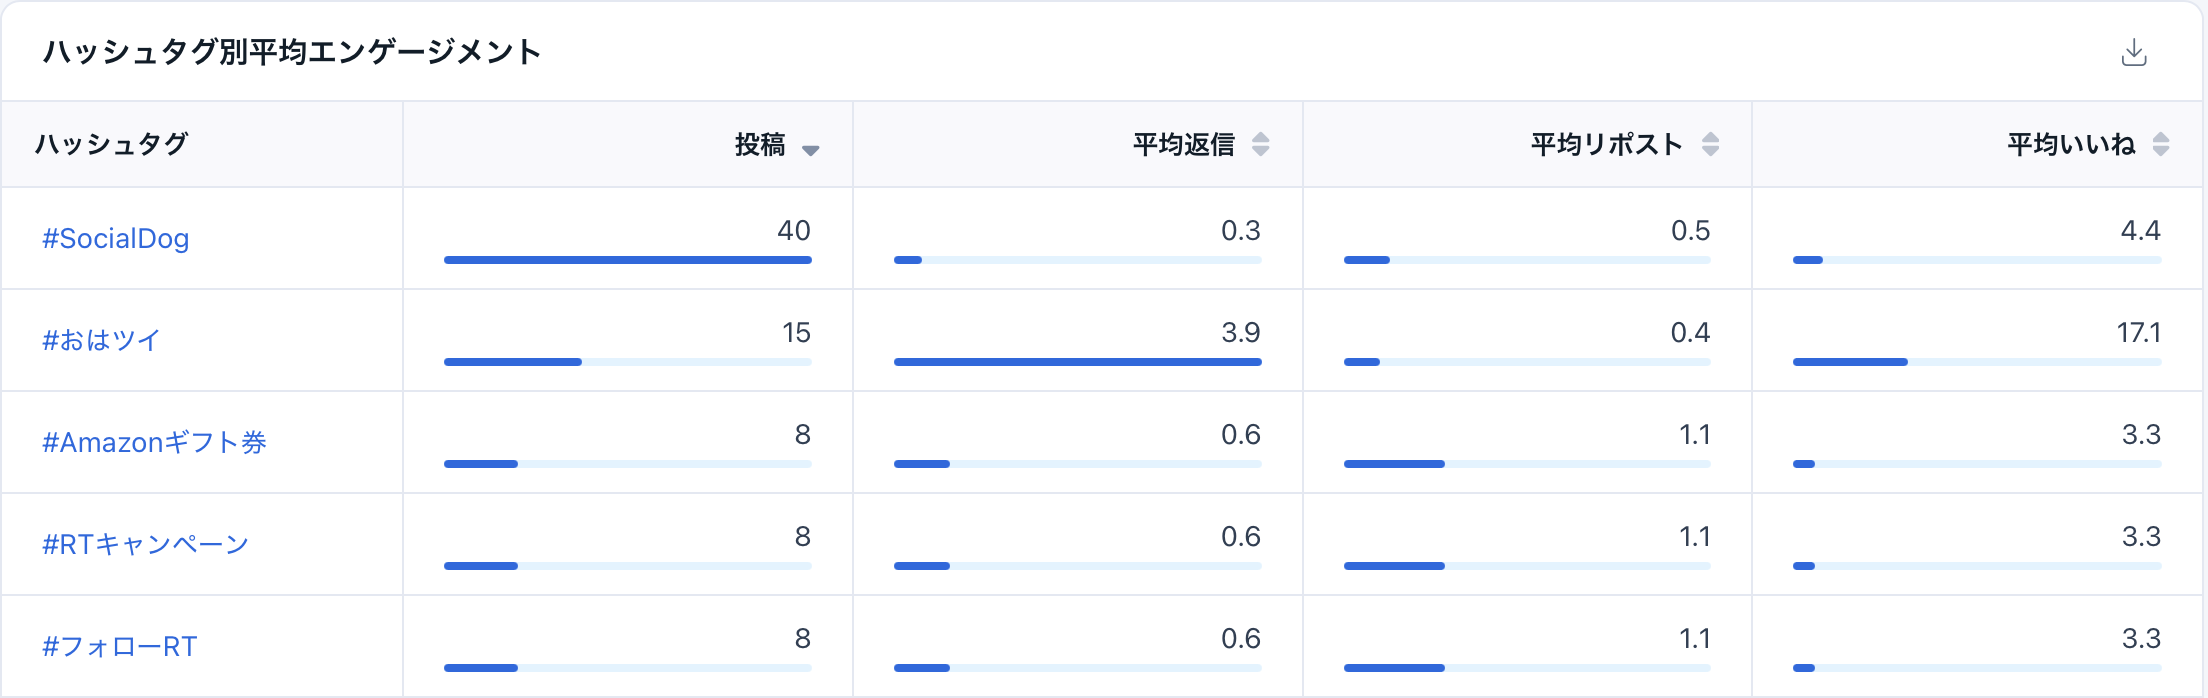
Average Engagement by Hashtag
In "Average Engagement by Hashtag", you can check "Number of Posts", "Average Number of Replies", "Average Number of Reposts (Retweets)", and "Average Number of Likes" for each hashtag used, in a table format.
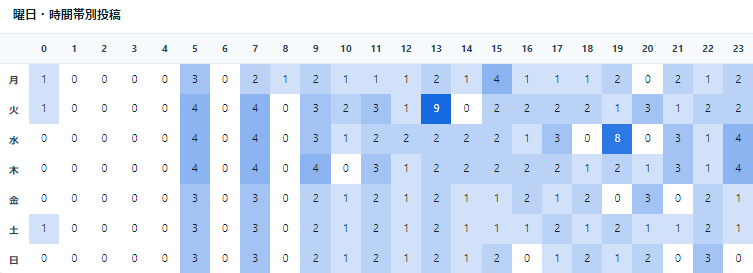
Posts by Day of Week/Time
In "Posts by Day of Week/Time", you can check the days of the week and times you posted in a table format.
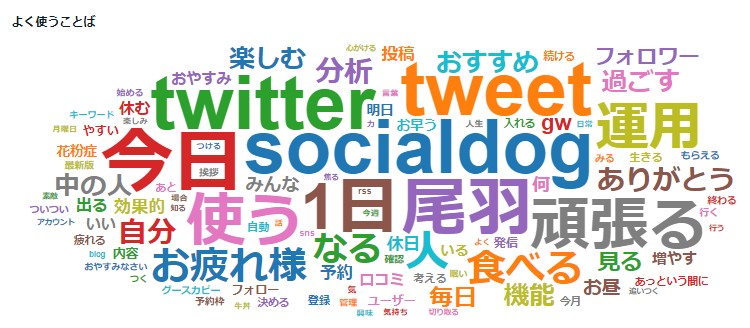
Frequently Used Words
In "Frequently Used Words", you can check the words you frequently use in your posts. Words used more often will be displayed larger.