Engagement (X)
「Engagement」 allows you to check the performance of user reactions. You can analyze posts with high engagement and apply insights to future account operations.
In each graph and table, values are displayed on the day they were posted from your X (Twitter) account. For example, if a reply to a post on July 1st occurs on July 2nd, it will be displayed as a reply for July 1st.
Analysis Items Available
- Engagement Summary
- Engagement
- List of High-Engagement Posts
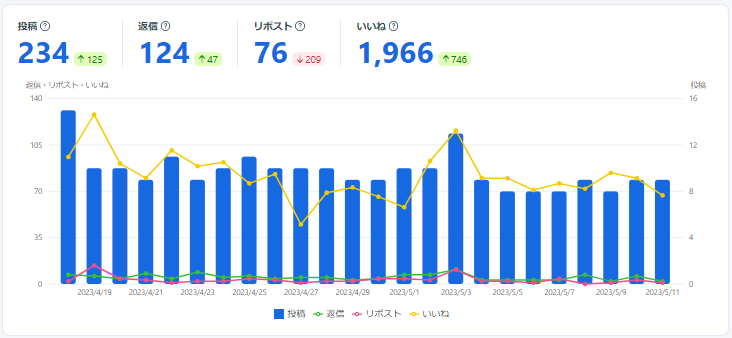
Engagement Summary
In Engagement Summary, you can check the total count for each type: "Number of your posts," "Number of replies to your posts," "Number of reposts (retweets) to your posts," and "Number of likes on your posts," as well as the number of items per period breakdown, in a graph.
Engagement
In Engagement, you can check the number of items per period breakdown for "Number of your posts," "Number of replies to your posts," "Number of reposts (retweets) to your posts," and "Number of likes on your posts" in a table format.

List of High-Engagement Posts
In the List of High-Engagement Posts, for posts within the specified period, "Number of Replies," "Number of Reposts (Retweets)," "Number of Likes," "Engagement," and "Impressions" can be checked in a table format. By default, they are sorted in descending order of engagement. Additionally, you can search for specific posts.
