Average Engagement (X)
In "Average Engagement," you can view average values for each type, such as "Your Number of Posts," "Average Replies to Your Posts," "Average Reposts (Retweets) to Your Posts," and "Average Likes to Your Posts," as well as average values for each period breakdown, in graphs and tables.
In each graph and table, values are displayed on the day they were posted from your X (Twitter) account. For example, if a reply to a post on July 1st occurs on July 2nd, it will be displayed as a reply for July 1st.
Analyzable Items
- Average Engagement Summary
- Average Engagement
- Post List
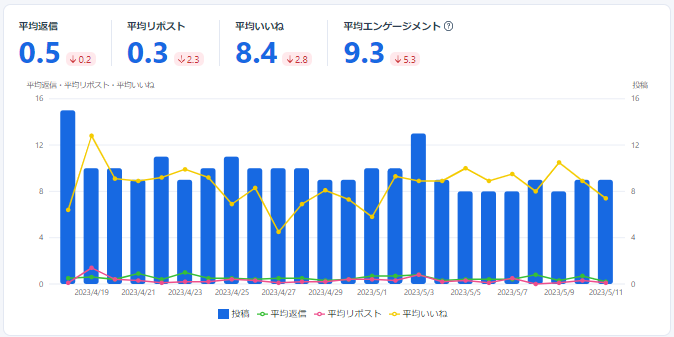
Average Engagement Summary
For each period breakdown, you can view replies, reposts, likes, and engagement per post in a graph.
Average Engagement

Post List
In the Post List, you can view "Replies," "Reposts (Retweets)," "Likes," "Engagement," and "Impressions" for your posts in a table format. By default, posts are sorted in descending order of engagement. You can also search for specific posts.
